My drawdown ladder works on QQQ. Falls 7.5% below its 52-week high, cash goes in.
I own individual stocks too, so I pointed the same rule at NVDA, AMD and SHOP to see what would happen. What happened is that it fires constantly and means nothing. It took me a while to work out why, because my first three theories were wrong.
Everything below runs the identical machinery: 252-session rolling high, tiers at 7.5, 10 and 15 percent, re-arm when the drawdown recovers past 6%. Close-based, which is what the research block inside my own alerter uses. Common window, about 9.9 years to July 2026.
Start with how much of the time each name is already down
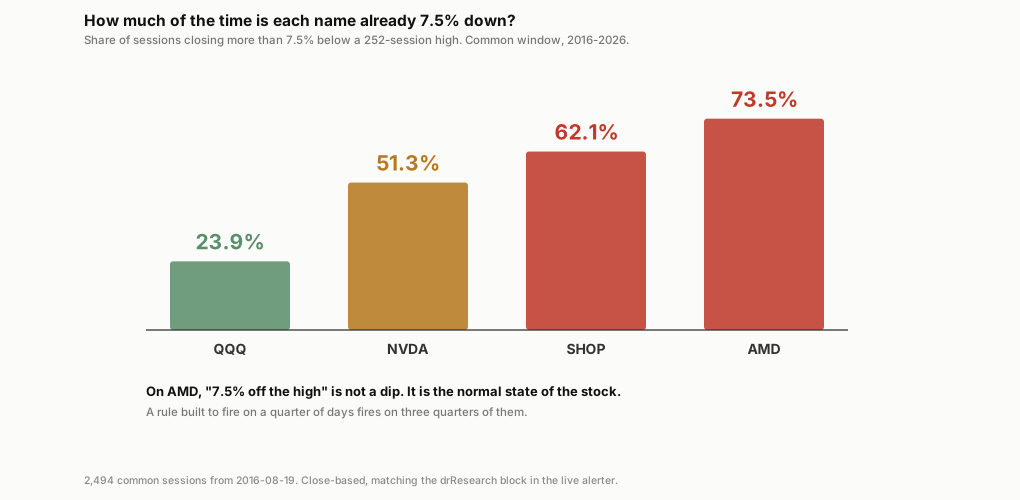
QQQ sits 7.5% or more below its 52-week high on 23.9% of sessions. NVDA 51.3%. SHOP 62.1%.
AMD: 73.5%.
Three days in four. On AMD that condition is the weather. I built something to detect an unusual state and aimed it at a stock where the state is ordinary. Roughly like setting a smoke alarm to go off at room temperature.
The alert count does what you'd expect
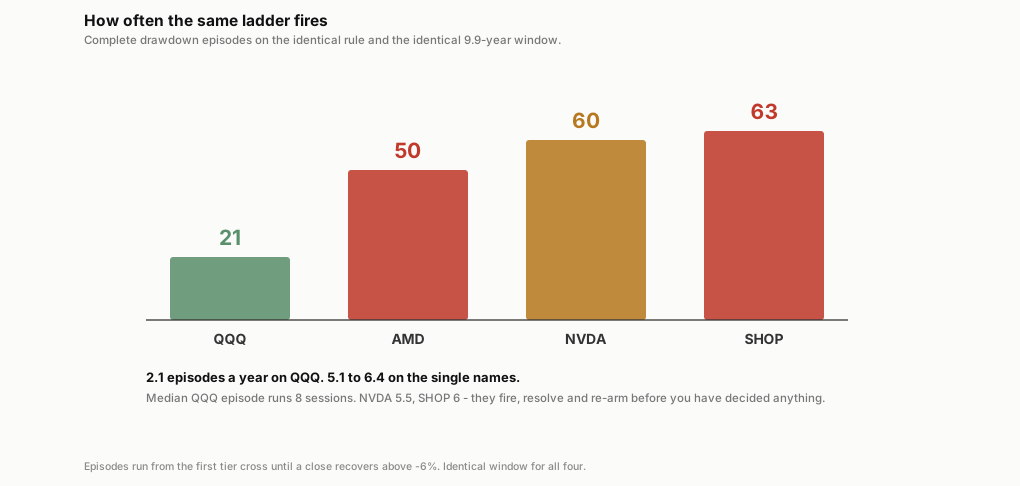
Over the same 9.9 years the ladder produced 21 complete episodes on QQQ. AMD 50, NVDA 60, SHOP 63.
Call it three times the alerts. My tranche schedule is 50/30/20, so a full episode spends the sleeve in three rungs. Sixty episodes against a sleeve built for a couple a year means the money is gone somewhere in year two. Every alert after that is a notification about nothing.
My first theory was wrong
I assumed single names fall further, and that this was the whole story.
Median episode depth: QQQ 10.8%, NVDA 10.4%, SHOP 10.7%, AMD 12.9%. Three of the four are inside half a point of each other, and AMD is two points deeper.
So depth isn't it. What changes is how often an episode starts and how quickly it's finished. Median duration runs 8 sessions on QQQ and 10 on AMD, but 5.5 on NVDA and 6 on SHOP. On those two the ladder fires, the dip resolves, and the rule re-arms inside a week. I'd still be reading the alert email.
The far tail does separate. Share of episodes that reach 15% down: QQQ 19%, NVDA 27%, SHOP 32%, AMD 46%. Nearly half of AMD's episodes become what my rule insists on calling a crash. Which tells you something about the rule.
The number I should have computed first
If 7.5% is meaningless on these names, what isn't?
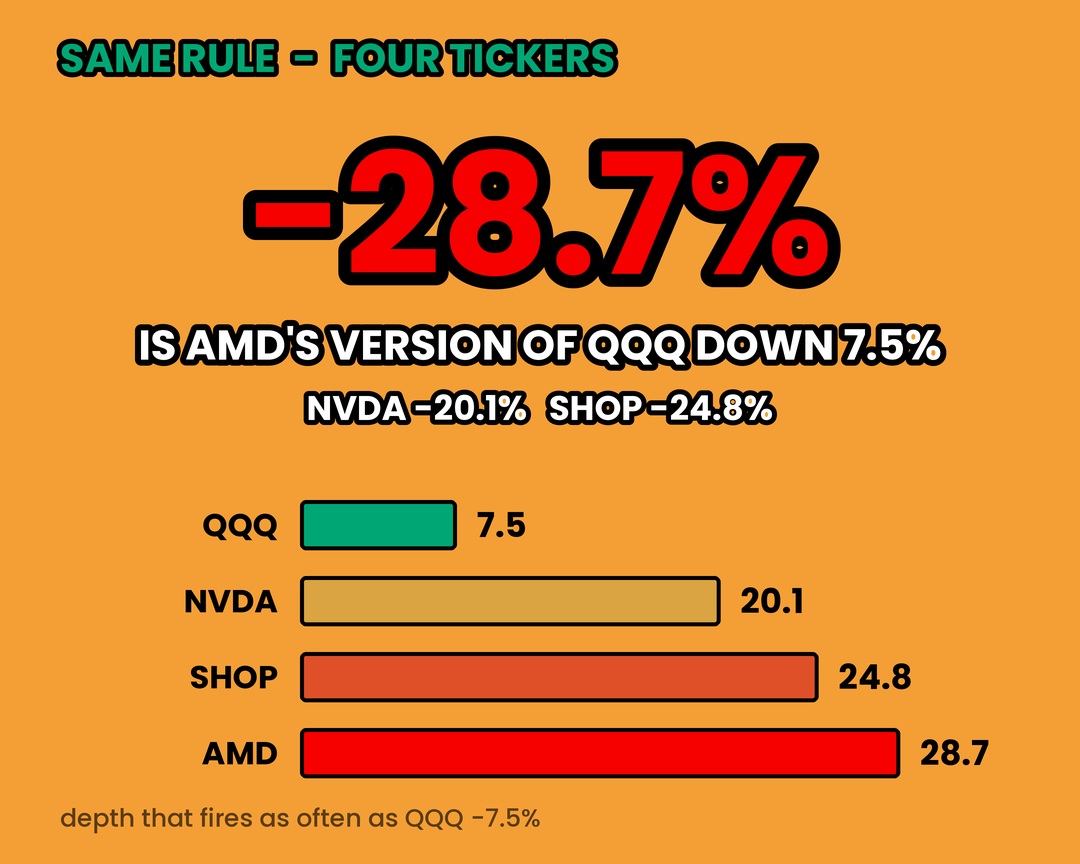
Take each stock's own drawdown distribution. Find the depth it sits below for the same fraction of days that QQQ sits below 7.5%.
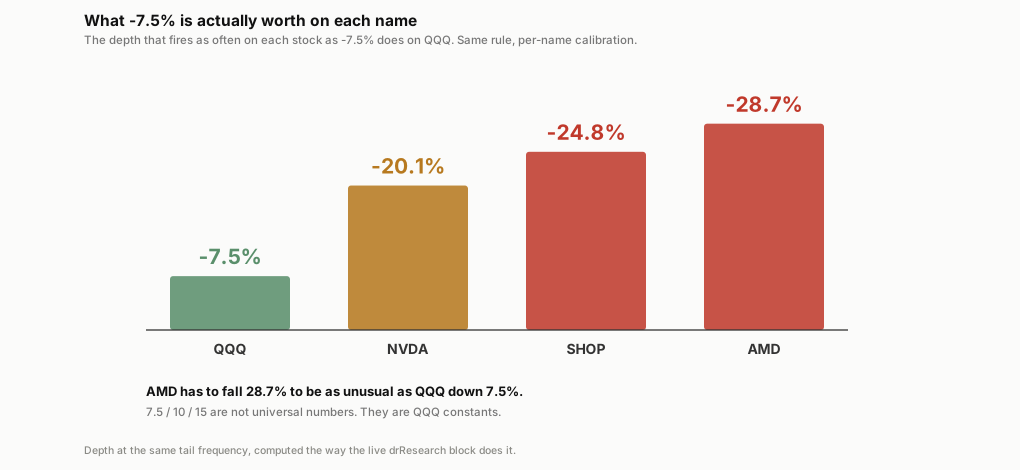
QQQ 7.5%. NVDA 20.1%. SHOP 24.8%. AMD 28.7%.
AMD has to fall 28.7% to be as unusual as QQQ down 7.5%.
7.5 / 10 / 15 aren't numbers that describe a dip. They're numbers that describe a dip in QQQ, and I'd been treating them as though they described the concept. Porting them to a semiconductor stock is the same class of error as hardcoding one volatility threshold across three names, which is a thing I have also done.
While I was in there I checked the volatility side
My covered-call alerter carries a per-stock threshold that's supposed to be that stock's own 75th-percentile 20-day realized volatility. The premise being that premium is rich in the top quartile, so that's when you want to sell.
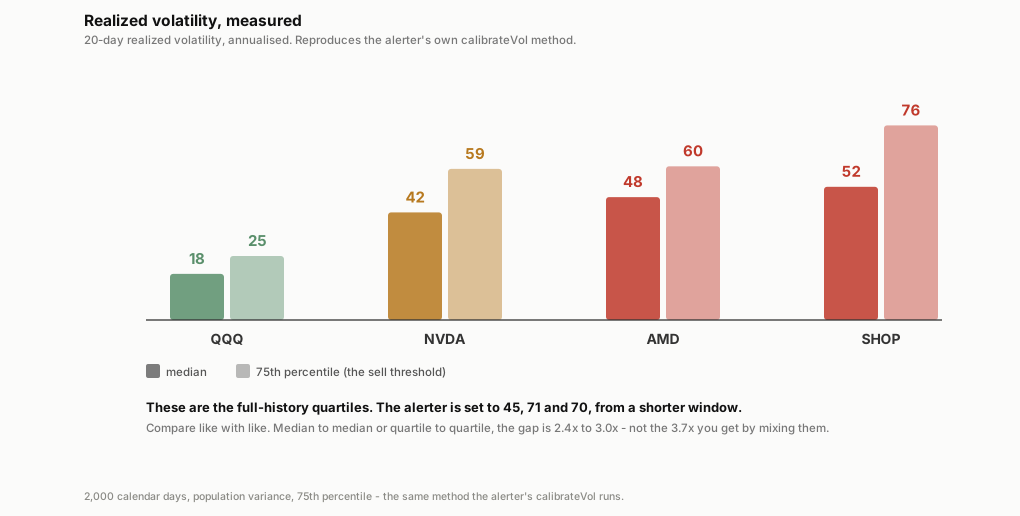
Reproducing that calibration over the window it uses: QQQ runs a median of 18 and a top quartile of 25. NVDA 42 and 59. AMD 48 and 60. SHOP 52 and 76.
Then I checked what the alerter is actually set to, and it is none of those. A recalibrator resets the thresholds on a two-year window rather than the full history. Its last run holds NVDA at 45, AMD at 71 and SHOP at 70.
Two calibrations, two windows, two answers, and the numbers sitting in the config file are not the ones doing the work. I went looking for a stale threshold and found a live one instead.
The thing I nearly published, though, was a comparison I'd been repeating for weeks without checking: these stocks' top quartile against QQQ's median of about 20. That gives a gap of 3.7x, and it's wrong, because it races a 75th percentile against a 50th. Quartile against quartile it's 25 versus 59, 60 and 76. Median against median, 18 versus 42, 48 and 52. Either honest version lands somewhere between 2.4x and 3.0x.
Still a wide gap. Wrong number, though, and I'd said it out loud more than once.
So
The threshold only carries information if it's unusual for the instrument. Same arithmetic on QQQ and on AMD, completely different meaning, and nothing in the rule knows the difference.
I expected depth to be the problem and it wasn't. Frequency and speed were. I'd have found that in ten minutes if I'd measured the day-share first instead of assuming.
If I ever do run a ladder on single names, the tiers come out of that stock's own distribution. For AMD that's around 28.7% where QQQ uses 7.5%. That's a real number I can act on, and it's the only useful thing in this whole exercise.
I do own one where the original tiers worked anyway. That turned out to be the least reassuring result of the three.
The 3.7x volatility claim was mine, I repeated it, and nobody else was ever going to catch it.
Not investment advice. Four tickers, about ten years, my own rule.
Growing Tendies does not accept any liability for any loss or damage which is incurred from any loss of money on a trade. All trades are done using the tastytrade platform.