I have a drawdown ladder. QQQ falls 7.5% below its 52-week high, a tranche of cash goes in. Down 10%, another. Down 15%, the rest.
Every alert email it sends quotes a base rate at me: of pullbacks like this one, X% went on to get worse. I put that number there. I had never measured it.
I had, in the meantime, read one of those emails as a reason to buy futures on margin, which is not what the thing is for.
So I measured it, and the number in the email was from a rule I stopped using months ago. Then I fixed that and found the fix was also broken. This post is both of those.
The rule, as the code actually runs it
Not the tidy version. The reference high is the highest close of the last 252 sessions, a rolling 52-week high. A tier fires when the day's low pierces it, because the live alerter polls every fifteen minutes and doesn't wait for the close. The episode ends when a close recovers to inside 6% of the high, and the ladder re-arms there. Tiers sit at 7.5, 10 and 15 percent, then every 5% deeper.
QQQ daily bars, 1999 to 2026. 6,677 sessions.
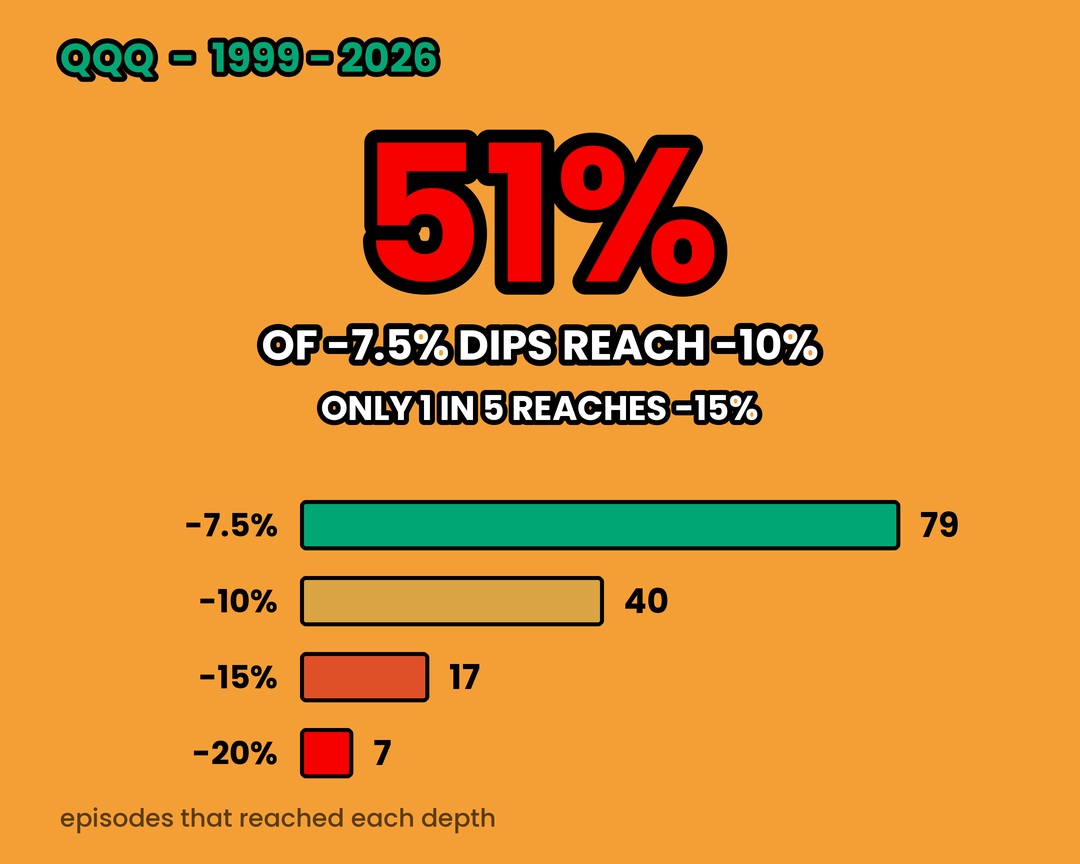
79 episodes
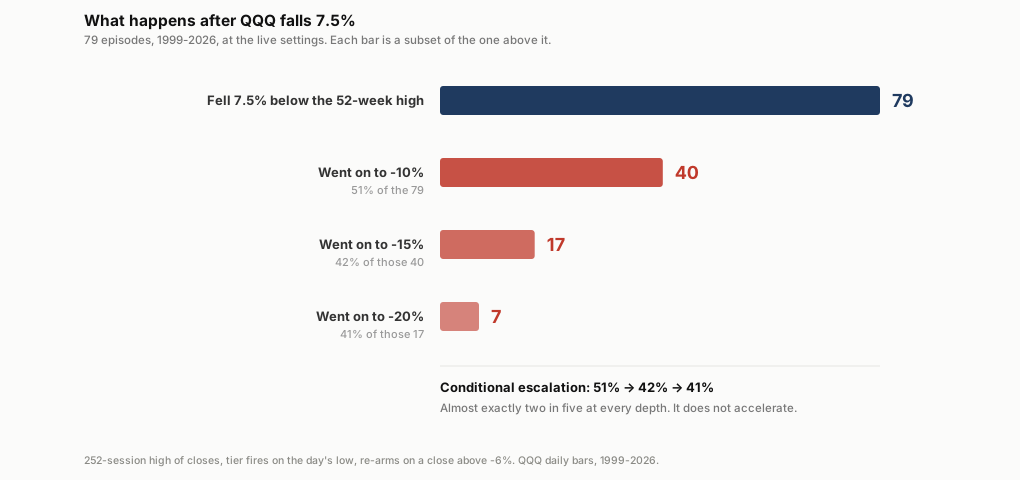
Of those 79, forty went on to 10% down. Seventeen reached 15%. Seven of the seventeen got to 20%.
As percentages: 51%, then 22% of the original set, then 41% of the crashes. A coin flip that a 7.5% dip becomes a 10% dip, and about one in five that it turns into something I'd call a crash.
What the emails had been saying
115 episodes, 48%, 20%.
Real numbers, wrong rule. They were measured back when the reference high was a 40-day window. A 40-day high ratchets downward as price falls, so a long grinding decline never reads as deep as it really was. In 2022 QQQ fell 35.4% and the 40-day reading topped out around 22%, which is exactly why I switched to 52 weeks.
What I didn't do was recompute the statistics afterward. There's a function in the file that does it, it writes the result to storage, and it only runs when I manually kick off a backtest. Until then the email falls back to a hardcoded constant, and that constant was left over from the old rule. So for however many weeks it's been, my alerter has been describing a 52-week signal in 40-day statistics.
I ran the backtest. It got worse.
The recomputation came back at 51 episodes, 49% reaching 10% down, 18% reaching 15%. Labeled 2011 to 2026.
Not 79. Not 1999, which is where the data starts and where the comment above the constant claims the numbers come from.
Here's what happened. The function that recomputes base rates uses whatever price history the backtest pulled. The backtest sizes that pull off a display setting, the one that controls how many years of alerts get listed in a spreadsheet tab I look at maybe twice a month. That setting is 15.
So my base rates are measured on a window with no dot-com crash and no 2008 in it. The two deepest episodes in the entire dataset, the 70% one and the 51% one, sit outside the lookback. The function has no way to know they exist.
1999 to 2026 | What the tool now emits | |
|---|---|---|
Episodes | 79 | 51 |
Reach 10% down | 51% | 49% |
Reach 15% down | 22% | 18% |
Of crashes, reach 20% | 41% | 56% |
Slowest escalation to 15% | 49 sessions | 23 sessions |
The headline rates barely move, which I found reassuring. Escalation really is stable across eras. What falls apart is the tail. On the fifteen-year window the slowest escalation to a crash you've ever seen took 23 sessions; on the full record it took 49.
I assumed that was the two big ones being cut, and it isn't. March 2000 and January 2008 went from the first alert to a crash in three sessions and five, which is about as fast as it gets. The slow ones are all shallow. Three episodes, from 2005, 2006 and 2010, took 49, 41 and 32 sessions to reach 15% and then barely went past it. The short window cuts those, not the crashes.
I went looking for a stale constant and found a live one being computed off too little data. One line fixes it: give the base-rate function its own history pull instead of borrowing the display window's.
And the comment was wrong too
Sitting above that constant, in my own handwriting, is a claim that escalation rises with depth. The deeper you go, the more likely you are to go deeper still.
It doesn't. 51%, then 43%, then 41%. Flat, at roughly two in five, at every level.
That claim came from a 61% figure at the bottom of the old chain, off a sample of 23 episodes. Change the lookback and it evaporates. I'd built a story on a number too small to carry one, and then left the story sitting there after the number changed.
Depth and duration
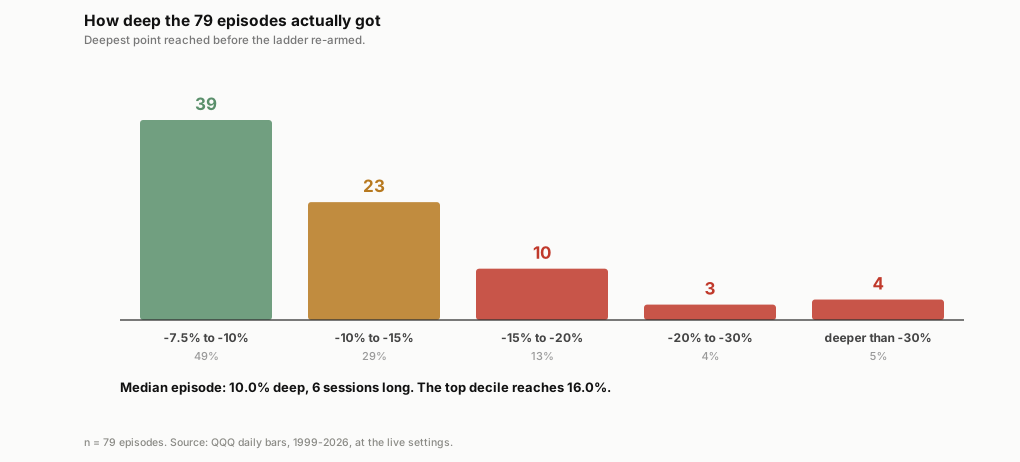
The median episode bottoms out 10.0% below the high and re-arms after 6 sessions. Under two weeks and it's finished. Thirty-nine of the seventy-nine never get past 10% at all.
Four went past 30%, and they don't resemble the median in any respect. March 2000 reached 70.1% down and took 791 sessions to re-arm. January 2008, 51.5% over 425 sessions. January 2022, 35.4% over 316. February 2020 hit 30.4% but was done in 52.
791 sessions is more than three years with the ladder open and empty. To me that matters more than the escalation rate. It is the scenario where the rule has spent everything and its only remaining move is to wait.
The speed caught me out
When escalation does happen it happens fast. Median gap from 7.5% down to 10% down is 2 sessions. Ninetieth percentile is 6. The slowest it has ever taken is 20.
From 7.5% to a full crash at 15%, median 8 sessions, slowest 49.
Two days, half the time, between the first alert and the second. That isn't enough time to look anything up. If the tranche sizes aren't already decided when the first email lands, they're going to get decided in a hurry. That is the specific failure the ladder was built to prevent.
Some context that never makes it onto a chart
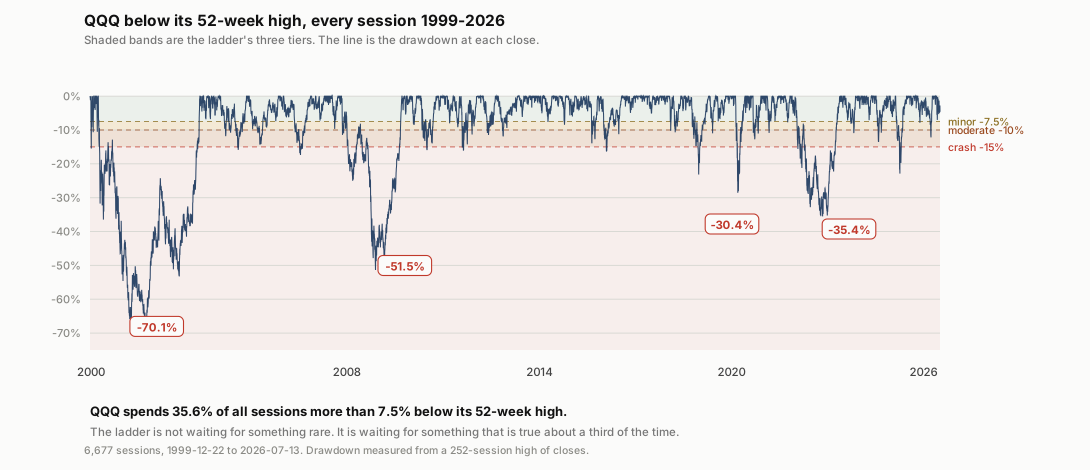
QQQ closes more than 7.5% below its 52-week high on 35.6% of all sessions.
A third of the time. I'd been carrying a mental image of "down 7.5% from the high" as an event, something that interrupts. It's closer to a season.
Where that leaves me
The base rate being a coin flip is fine. 51% means the second tranche fires about half the time. It also means that half the time I deployed at 7.5% and the whole thing was over. Both are true. Neither is a reason to change anything.
The speed is the constraint that actually binds, not the frequency. Two sessions means the sizing is decided in advance or it isn't decided at all.
And then the part I keep circling back to. I changed one constant. I left behind the statistics, the explanatory comment, and two lines of email copy, all of them describing the old behavior. The self-updating base rates were the piece I trusted most, and they were quietly measuring fifteen years because they'd inherited a spreadsheet setting. A number that recalculates itself still has a window. Mine doesn't print the window on the email, and I'm going to fix that before I fix anything else.
The same rule pointed at single stocks fails for a different reason again. And the one stock where it did work is the least comfortable result of the three.
Not investment advice. Base rates rather than predictions, off 79 events in 27 years.
Growing Tendies does not accept any liability for any loss or damage which is incurred from any loss of money on a trade. All trades are done using the tastytrade platform.