There's a warning about this exact stock in my own code. It says SHOP peaked near $169 in 2021 and never recovered. On that telling, every tier alert on the way down was a buy signal into a name still underwater.
I put it there as a counterweight to two posts of mine. One measured what the tiers actually predict on QQQ. The other found they mean nothing on single stocks.
Went back to write it up properly and found the warning had stopped being true in October 2025. I hadn't noticed. The way it stopped being true is worse than if it had held.
What happened
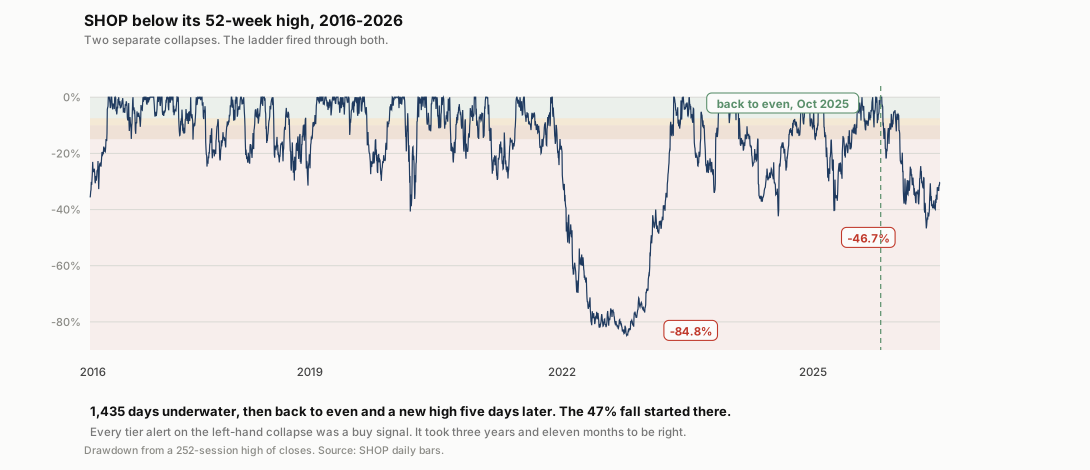
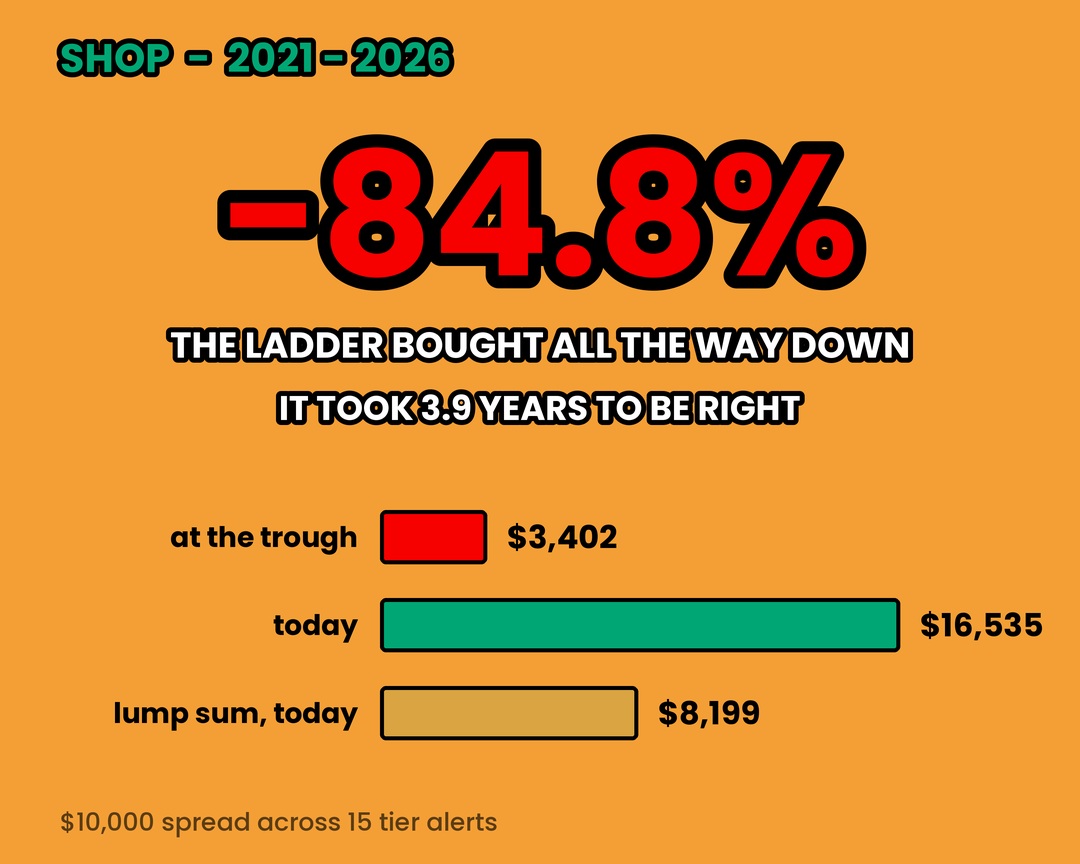
SHOP closed at $169.06 on 19 November 2021. Eleven months later it was at $25.67. Down 84.8%.
My ladder fired fifteen times on the way. Every tier from 7.5% to 80%, at 152, 146, 141, 133, 122, 117, 106, 88, 82, 75, 66, 56, 48, 42 and 34 dollars. Fifteen buy signals on the way down.
Then it climbed the whole way back. First close above the 2021 high was 24 October 2025. 1,435 days. Three years and eleven months of being wrong, and I never noticed, because I'd written the comment and moved on.
Five days after that it printed a new all-time high at $179.01. Then fell 46.7% to $95.40 by May 2026. It closed at $124.77 on 14 July, and the ladder has fired sixteen more times since 4 November.
So the ladder was right
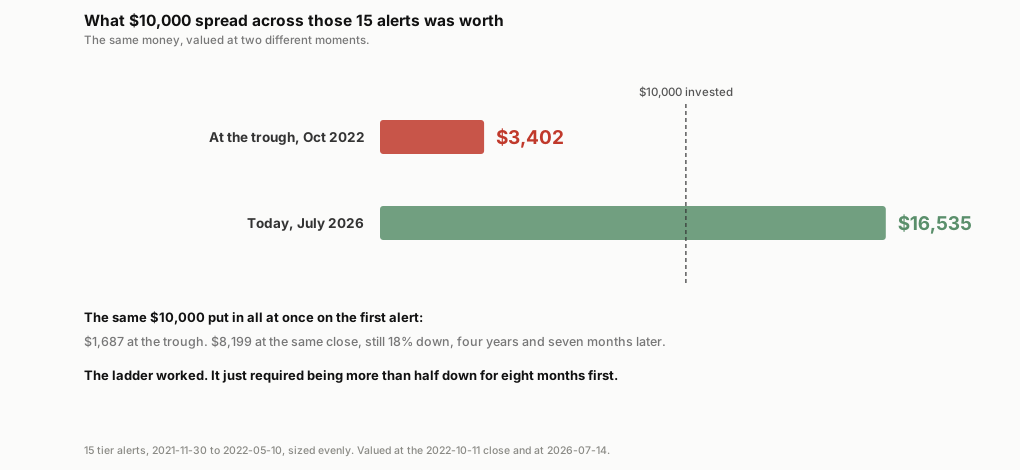
Ten thousand dollars spread evenly across those fifteen alerts is worth $16,535 at that price. Up 65%.
The same ten thousand, in October 2022, was worth $3,402.
That's one decision looked at on two different days. The lump-sum version, everything in at the first alert, is worth $8,199 at the same price, still down 18% after four years and seven months. So the ladder beat it comfortably, which is the answer I wanted. But getting it meant sitting on a position down more than half for eight months, while the stock kept making new lows.
It touched two thirds down for one session. That is the number I would have quoted if I hadn't checked how long it lasted.
The bit I keep getting stuck on
I've written two posts about this ladder and both were engineering. Are the tiers set right, are the base rates measured right. Questions with answers.
This isn't one of those.
On QQQ the ladder is a bet on mean reversion. The index does something a single stock cannot: it quietly drops the companies that failed and keeps the ones that didn't. Some of the recovery is built into the instrument. Nobody has to be right about anything.
On SHOP, all fifteen alerts were a bet that the business was fine. That bet was correct. Nothing in the drawdown series told me it would be. The alert that fired at 80% down on SHOP is arithmetically identical to the alert that would have fired at 80% down on a company that never came back. I don't own a tool that separates those two cases. I'm not sure one exists.
The ladder didn't know SHOP would recover. I didn't either. It recovered, and now I've got a chart that makes the whole thing look like judgment.
The comment problem, again
That warning was accurate when I wrote it and went stale in October 2025. I only caught it because I went hunting for a cautionary tale and the data wouldn't give me one.
Nothing flagged it. It's prose sitting above a config block and prose doesn't execute.
Third time in two weeks. The escalation base rates were from a rule I'd replaced. Two lines of alert copy described behavior the code no longer had. Now a warning about a stock that had already recovered.
The code was right all three times. I wrote the English too.
What I'm doing about it
Keeping the ladder on QQQ. The reason hasn't changed, and it was never really about returns. It fixes the position size while I'm calm rather than while I'm watching a red screen. I have two blown-up accounts that argue for that.
Not running it on single names. And the reason is this post rather than the frequency argument from part two. That argument was about calibration, and calibration is fixable. Set AMD's tier at 28.7% instead of 7.5% and the firing rate lines up.
This isn't fixable. There's no threshold anywhere that separates a company having a terrible two years from a company that's finished. SHOP at 80% down and a permanently broken business at 80% down produce identical alerts. Recalibrating moves when the email arrives. It doesn't add any information about what the email means.
If I'd pointed this at the wrong stock the chart above would be the same shape. The number at the end would be zero. And I'd have written something about how disciplined the system was.
The honest summary
SHOP recovered. That's one draw from a distribution I can't see. It is also the draw that happens to be in my portfolio, which is why I shouldn't be reasoning from it at all.
A backtest that reports the ending value without the path is describing something nobody could have sat through.
Every stale claim I've found in this project was a comment or a copy string that stopped matching the code. More comments isn't the answer. Fewer claims in them, and the ones that survive should say where their number came from, so the next reader knows when to doubt it.
Not investment advice. One stock, chosen because I own it, which is the problem the post is about.
Growing Tendies does not accept any liability for any loss or damage which is incurred from any loss of money on a trade. All trades are done using the tastytrade platform.