Quick disclosure: this is a personal trading journal, not investment advice. I trade at tastytrade with my own money. That link and the one at the bottom use my referral code, so I may get a referral bonus if you open an account through them. It doesn't change what I write. Read the full disclaimer.
Part 3 of 3 in the FOMC study. Part 1, the trade · Part 2, the research
Last time I spent $11 finding out my FOMC pattern was something I'd made up three days after the fact.
So there's no direction edge. Fine. I made my peace with that.
But there was an obvious next question sitting right there, and it took me about four minutes to get to it.
If I can't tell you which way the market goes on Fed day, can I just sell the fact that it's going to move?
Trade summary
Because that's the thing everybody says about events. The options get expensive into them. Implied volatility (the move the option market is pricing in) goes up, the event happens, the move is smaller than advertised, and the premium collapses. Sell the straddle at 1:50 PM, let it expire at the close, collect.
I already sell premium. My covered call script writes them about three weeks out. So this isn't some foreign idea to me — it's the thing I'm already comfortable with, pointed at a date on the calendar.
The options data cost about eight cents.
Here's what came back.
The number that should have ended it
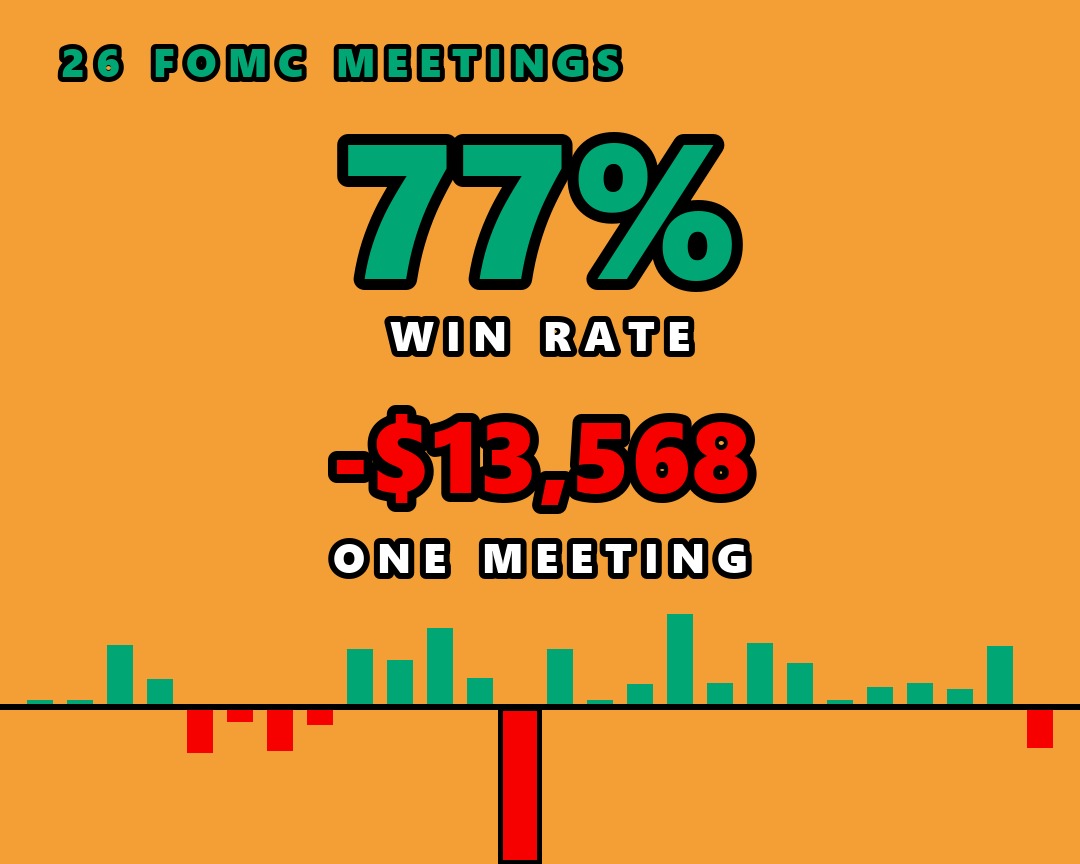
Twenty wins out of twenty-six. 76.9%.
Twenty-six FOMC meetings, March 2023 through July 2026. Each one: price the at-the-money straddle at 1:50 PM, compare what it implied against what the market actually did by the close. A 0DTE (zero days to expiration) straddle pays out at expiry, so realized-to-close is the honest comparison.
The market overpriced the FOMC move 77% of the time.
Average edge per event, in dollars, on a single E-mini straddle: +$581.
I want you to notice how good that feels to read. Seventy-seven percent. Five hundred and eighty-one dollars, eight times a year, for doing nothing but selling a thing on a Wednesday afternoon.
I sat with that number for a while.

Then I looked at the other six
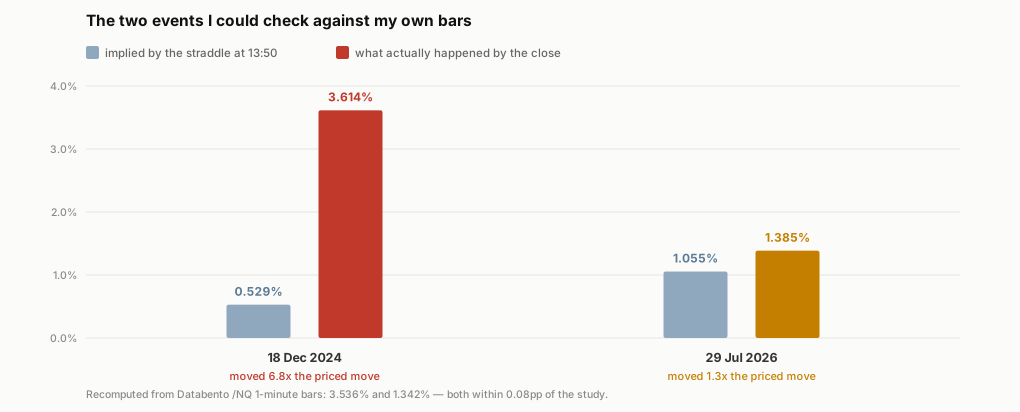
18 December 2024.
The straddle implied a 0.529% move. The market delivered 3.614%.
Six point eight times the priced move.
On one E-mini straddle that is −$13,568.
It takes twenty-four winning meetings to earn that back. At eight FOMC meetings a year, that's three years of collecting premium to pay for one Wednesday afternoon.
And it's worse than that. Across all 26 events the total edge is −3.466pp. Take out 18 December 2024 and it's −6.551pp.
One meeting out of twenty-six erased 47% of everything else earned.
So is the edge real?
No. Here's the part that the 77% hides.
Mean edge across the sample: −0.133pp. Median: −0.232pp.
t = −0.85. p = 0.402.
That is not an edge. That's noise with a good win rate stapled to it.
What did I learn here? I learned that a win rate is not a strategy. A win rate is one number out of the three you need, and the other two — how big the wins are and how big the losses are — are the ones that decide whether you keep your account.
Seventy-seven percent of the time you're right and you get paid a little. Twenty-three percent of the time you're wrong and once in a while the move is nearly seven times the one the market priced, and you hand back close to six times the premium you collected.
The part where it stops being abstract
I have done this trade before.
Not on FOMC. Through January 2022 I was carrying short MNQ puts, sold in November and rolled twice as they went against me. Small consistent wins, then one move that took all of it and then some. The damage that time ran through the whole portfolio rather than one account, and it was a great deal larger than anything in this study.
What I did not have, until now, was the arithmetic.
That's what this study gave me. Not a new lesson — the same lesson, with numbers attached. The payoff shape that blew me up is the same payoff shape as selling FOMC volatility. Different instrument, different year, identical structure: collect a little, often, and hand back a lot, rarely.
And I'd have walked straight into it again, because 77% is a genuinely persuasive number and $581 an event sounds like a plan.
The one that went the other way
Last week's meeting, 29 July 2026, went long vol.
Implied 1.055%. Realized 1.385%. The short-vol seller lost on that one.
A 9–3 vote with three dissenters wanting a hike is exactly the kind of surprise that beats the priced move. Which is the whole problem in one line: the meetings that break you are the ones nobody had a reason to expect.
What I'd want to know before believing any of this
Four things, and I'd rather say them than have someone else say them for me.
The sample is short and it's one regime. CME Wednesday weeklies on E-mini NQ don't resolve before March 2023, so this is 26 events across a single stretch of market. That is not a lot of Fed meetings.
The results are gross, before fees. No commission, exchange or clearing fee is deducted anywhere in this study. Real round-turn costs on 0DTE options come off the top of every one of those 20 wins and add to each of the six losses.
The prices are mid-market. Every straddle in this study is priced at the midpoint of the bid and ask. Real execution sells the bid and buys the ask. This study never measured the spread, so the size of that bite is not something I can put a number on here. The measured edge it comes out of is about 29 points. A spread-aware version of this study makes the number smaller, not bigger.
And the effect wasn't significant to begin with. So it's a small unproven edge, measured optimistically, with a documented catastrophic tail.
Takeaways
- A win rate is the least informative number on the page. 76.9% sounds like a business. The mean edge is −0.133pp and it fails significance at p=0.402. If someone shows you a win rate before they show you the size of the losses, the win rate is doing PR.
- The tail is not a footnote, it's the whole distribution. One meeting out of 26 wiped out 47% of everything else the strategy earned. That's not bad luck contaminating a good strategy. That IS the strategy — you just don't see it in most samples.
- Recognizing a payoff shape is worth more than recognizing a setup. I didn't need to know anything about SPX or 0DTE or the Fed to see this coming. I needed to notice it was the same shape as January 2022. Shapes generalize across instruments. Setups don't.
Verdict
Not taking it. Wins 77% of the time, fails significance, and one meeting in twenty-six costs nearly three years of collecting.
Which is not the same as "never sell premium." I still write covered calls three weeks out, and the study says something adjacent to that: over the five sessions after an FOMC date the study measures roughly 10% more realized volatility, and the 3.75x belongs to the ten-minute window around the release, not to the week — what it does not measure is the decay past five sessions, where its own table falls to 1.024x by twenty-one, or whether implied vol rises to match. So I cannot tell you whether the writer is being overpaid or underpaid.
The difference is structural. My covered calls are backed by shares, and when volatility rises the script widens the strike distance instead of adding contracts. Selling a naked FOMC straddle sized off the median outcome does the opposite.
Same activity. Opposite risk shape. That distinction is worth more to me than the $581.
Running research cost for this whole thing: still about $11.
Next one I want to look at is a service I found selling the same kind of short-premium trade to other people, advertising a 95.0% live win rate on its homepage as of August 2026. I have some questions about that.
Catch you next week.
I trade futures and options at tastytrade with my own money. The link uses my referral code, so I may get a referral bonus if you open an account through it. It's also just where these fills come from.
Get the next one
I publish every test I run, including the ones that prove me wrong. If that is worth something to you, join the mailing list and the next one lands in your inbox.
Growing Tendies does not accept any liability for any loss or damage which is incurred from any loss of money on a trade. All trades are done using the tastytrade platform.