Disclosure: I earn nothing from this page. There are no affiliate links here, no broker deals. If that ever changes, I'll say so right here, in this spot, before anything else.
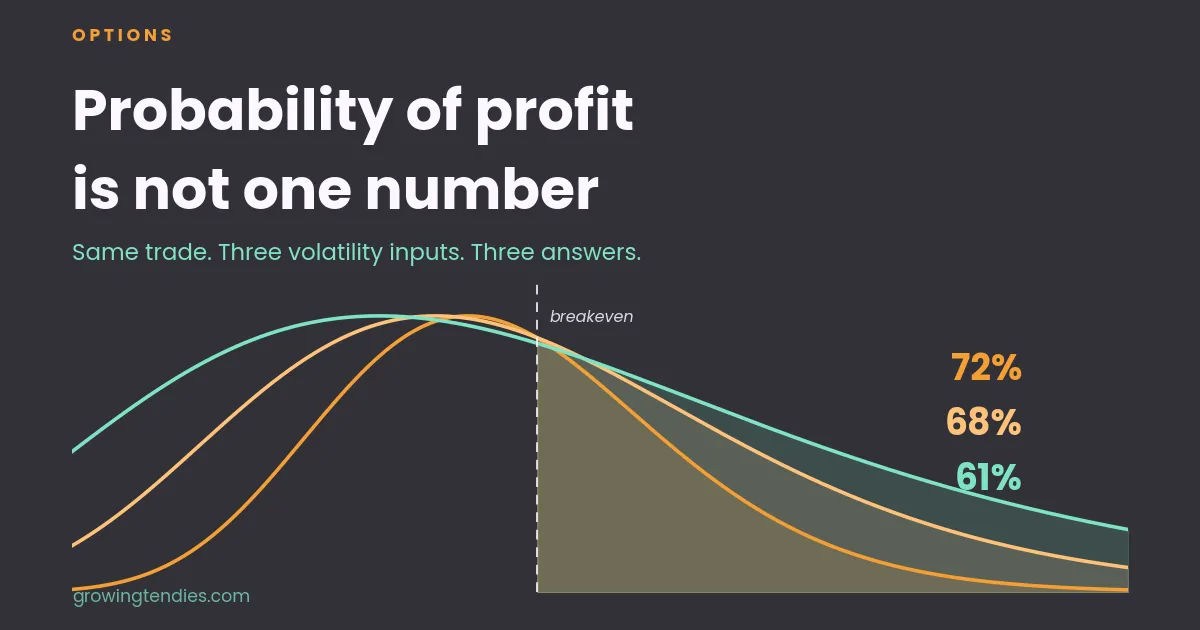
Your broker puts the trade at a 68% chance of profit. My calculator says 61%. Some third tool says 72%.
Nobody's lying. Those are three different questions wearing the same name.
Probability of profit gets modelled, never measured, and the model needs a volatility number that nobody agrees on. Change the volatility input and the probability changes with it.
That's the whole article. Everything below is why it matters when you're the one selling the option.
What the number actually is
Probability of profit, or POP, is one calculation with a lot of assumptions bolted on.
You take today's price. You assume the price at expiration lands somewhere randomly around it, in a shape called lognormal, which just means it can't go below zero and the upside tail runs longer than the downside. Then you work out how much of that shape falls on the profitable side of your breakeven.
That's it. It's the area under a curve.
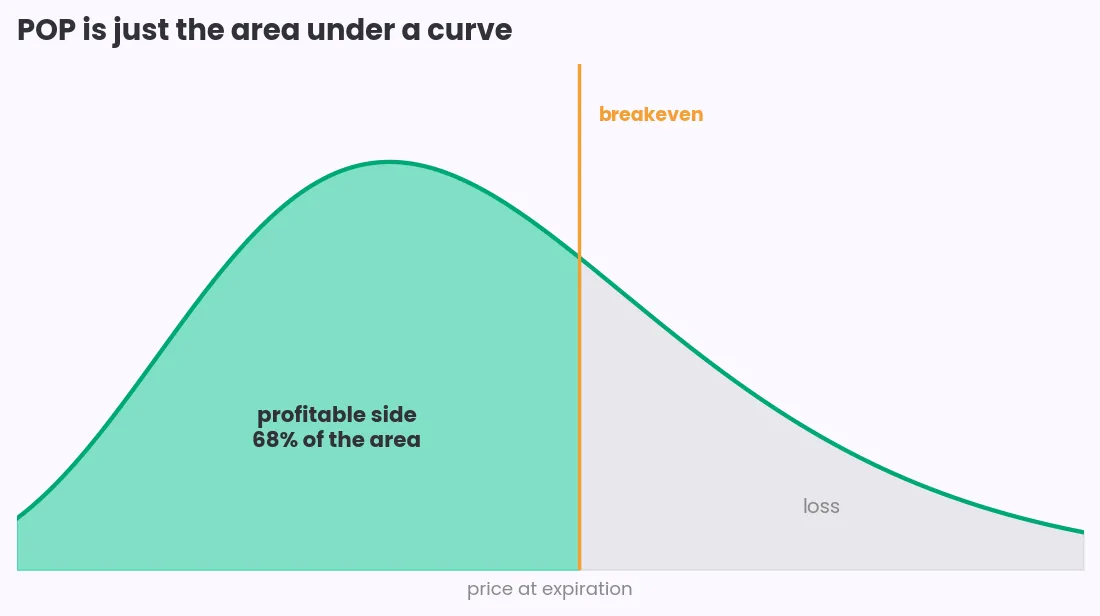
So the number depends entirely on how wide you drew the curve. The width is volatility.
Two volatilities, and they disagree on purpose
Realized volatility is how much the stock actually moved. Take the last 20 or 30 days of closes, compute the standard deviation of the daily returns, annualize it. It's history. It's a fact.
Implied volatility (IV) is what the option's market price says traders expect it to move. Take the price somebody is actually paying, run the pricing model backwards, and solve for the volatility that produces it. That's an opinion, backed by real money, but still an opinion.
They're almost never the same. Implied usually runs higher.
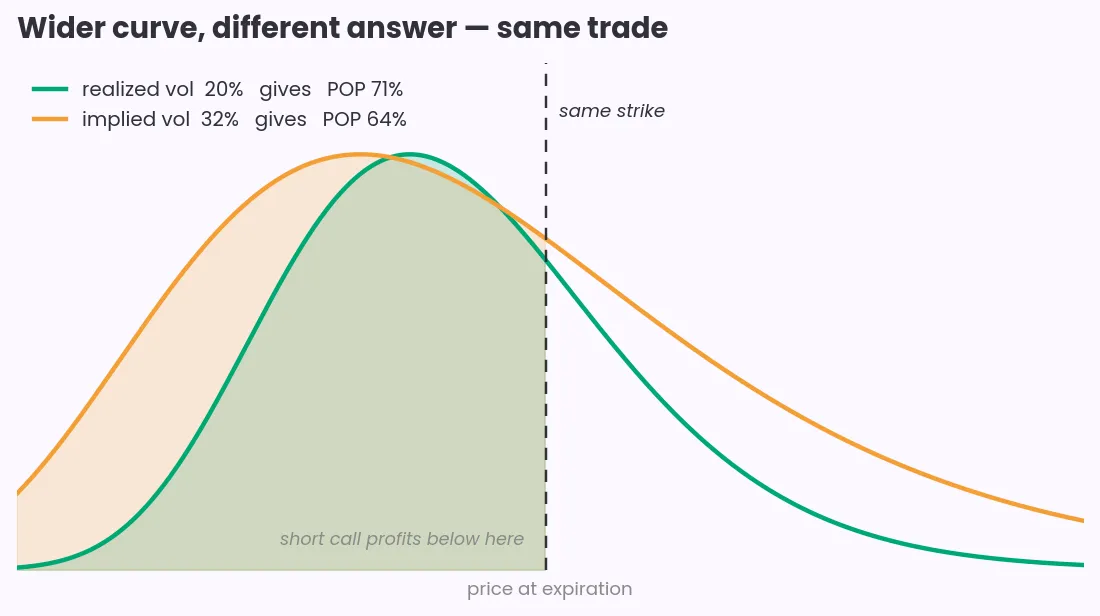
Why? Because whoever sold you that option took on unlimited or near-unlimited risk for a fixed premium, and they want paying for it. The gap between implied and realized is roughly the fee for carrying the tail.
Which means your broker's POP, computed from implied vol, and mine, computed from whatever realized vol you type in, will disagree. Structurally. Every time.
Which one flatters you
This is the part I care about, because it's the part that cost me.
Selling options? Implied vol usually runs higher than realized, a wider distribution means a bigger chance of touching your strike, so your broker's POP is generally the more conservative one. Your broker is being harder on you than my calculator is.
Buying options, the same gap runs the other way. You're paying for movement that historically didn't show up.
Now watch what happens when the market changes character.
Implied vol spikes first and hardest in a selloff. The premiums get fat. Selling looks better than it has in months, on a screen full of green probability numbers.
That's exactly the moment the distribution you drew stops describing anything.
I sold options into a bear market once. Premiums were enormous, the probabilities looked wonderful, and the model producing those probabilities assumed tomorrow would look like the last 20 days.
It didn't.
That drawdown is why I run written rules now instead of judgment.
What POP leaves out
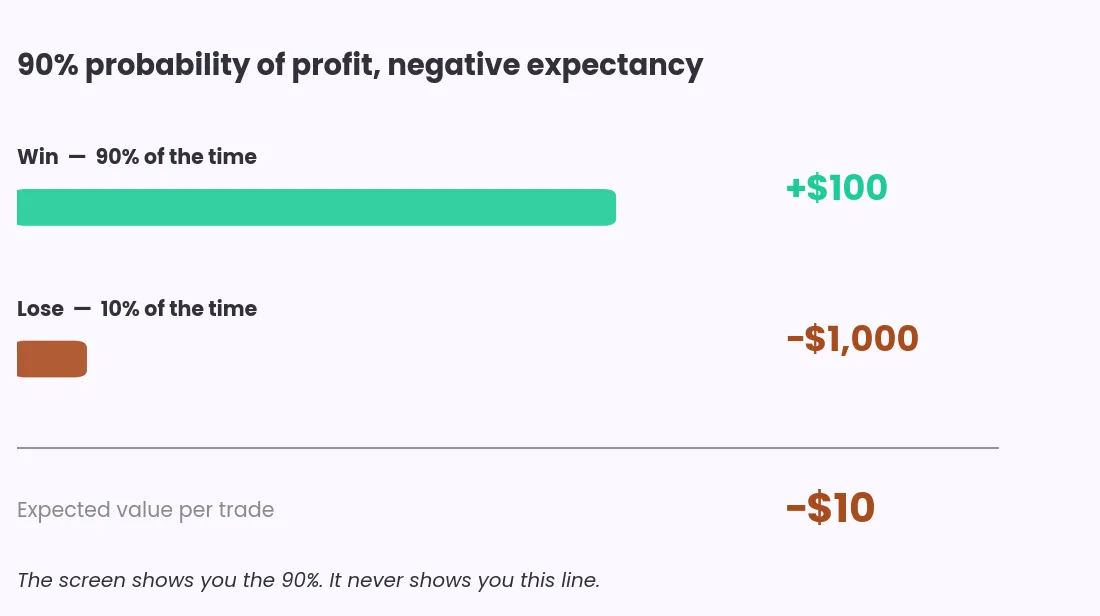
The size of the loss never appears. A 90% probability of profit against a maximum loss of ten times the premium is a coin flip you'll lose eventually. Expectancy and probability are separate questions, and only one of them is on your screen.
Early assignment isn't in there. Every POP calculation I know of, mine included, computes at expiration. American-style options can be exercised any day. Short calls on a stock going ex-dividend get assigned early all the time, and the payoff diagram never mentioned it.
Neither is the earnings report. Fit a model to the last 20 quiet days and it'll happily tell you the next 20 are quiet too. The calendar disagrees.
What to actually do with it
Use it as a comparison, not a forecast.
Two trades, same inputs, same method? The one with the better POP is genuinely better on that dimension. That comparison is useful, and it's what the number is good for.
One trade, one number, treated as the odds the trade works? That's where people get hurt. 68% is one model's opinion, and you picked the input.
When your broker's number disagrees with mine, don't take the one you like better. Ask what changed between them. The answer is almost always volatility, and that difference is a real thing about the market you're about to trade in.
It's the same reason I spent $11 testing a pattern I was sure about instead of sizing up on it. Cheap disagreement beats expensive confidence.
Use the calculator
I built an options profit calculator that shows the payoff at expiry, the breakevens, the maximum profit and loss, and a probability of profit computed from the realized volatility you enter.
It says so on the page, in the same spot every time. The probability is a model estimate, it assumes zero expected drift, and it uses your volatility number rather than the market's. It will disagree with your broker, and showing you both is the point.
It's free, nothing's gated, and I don't earn anything if you use it.
Trading futures instead? There's a futures calculator, and I wrote up where that math goes wrong too. Still figuring out which broker to run any of this through? I went through eight of them here.
Illustrative percentages at the top are examples, not quotes from any specific platform.
This is a journal and a set of tools, not investment advice. Options carry risk of total loss, and short options carry risk beyond the premium collected. Check live quotes and your own broker's numbers before trading anything.